The NYT has a cool interactive map that lets you view this research result:
http://www.nytimes.com/interac....2&abg=1
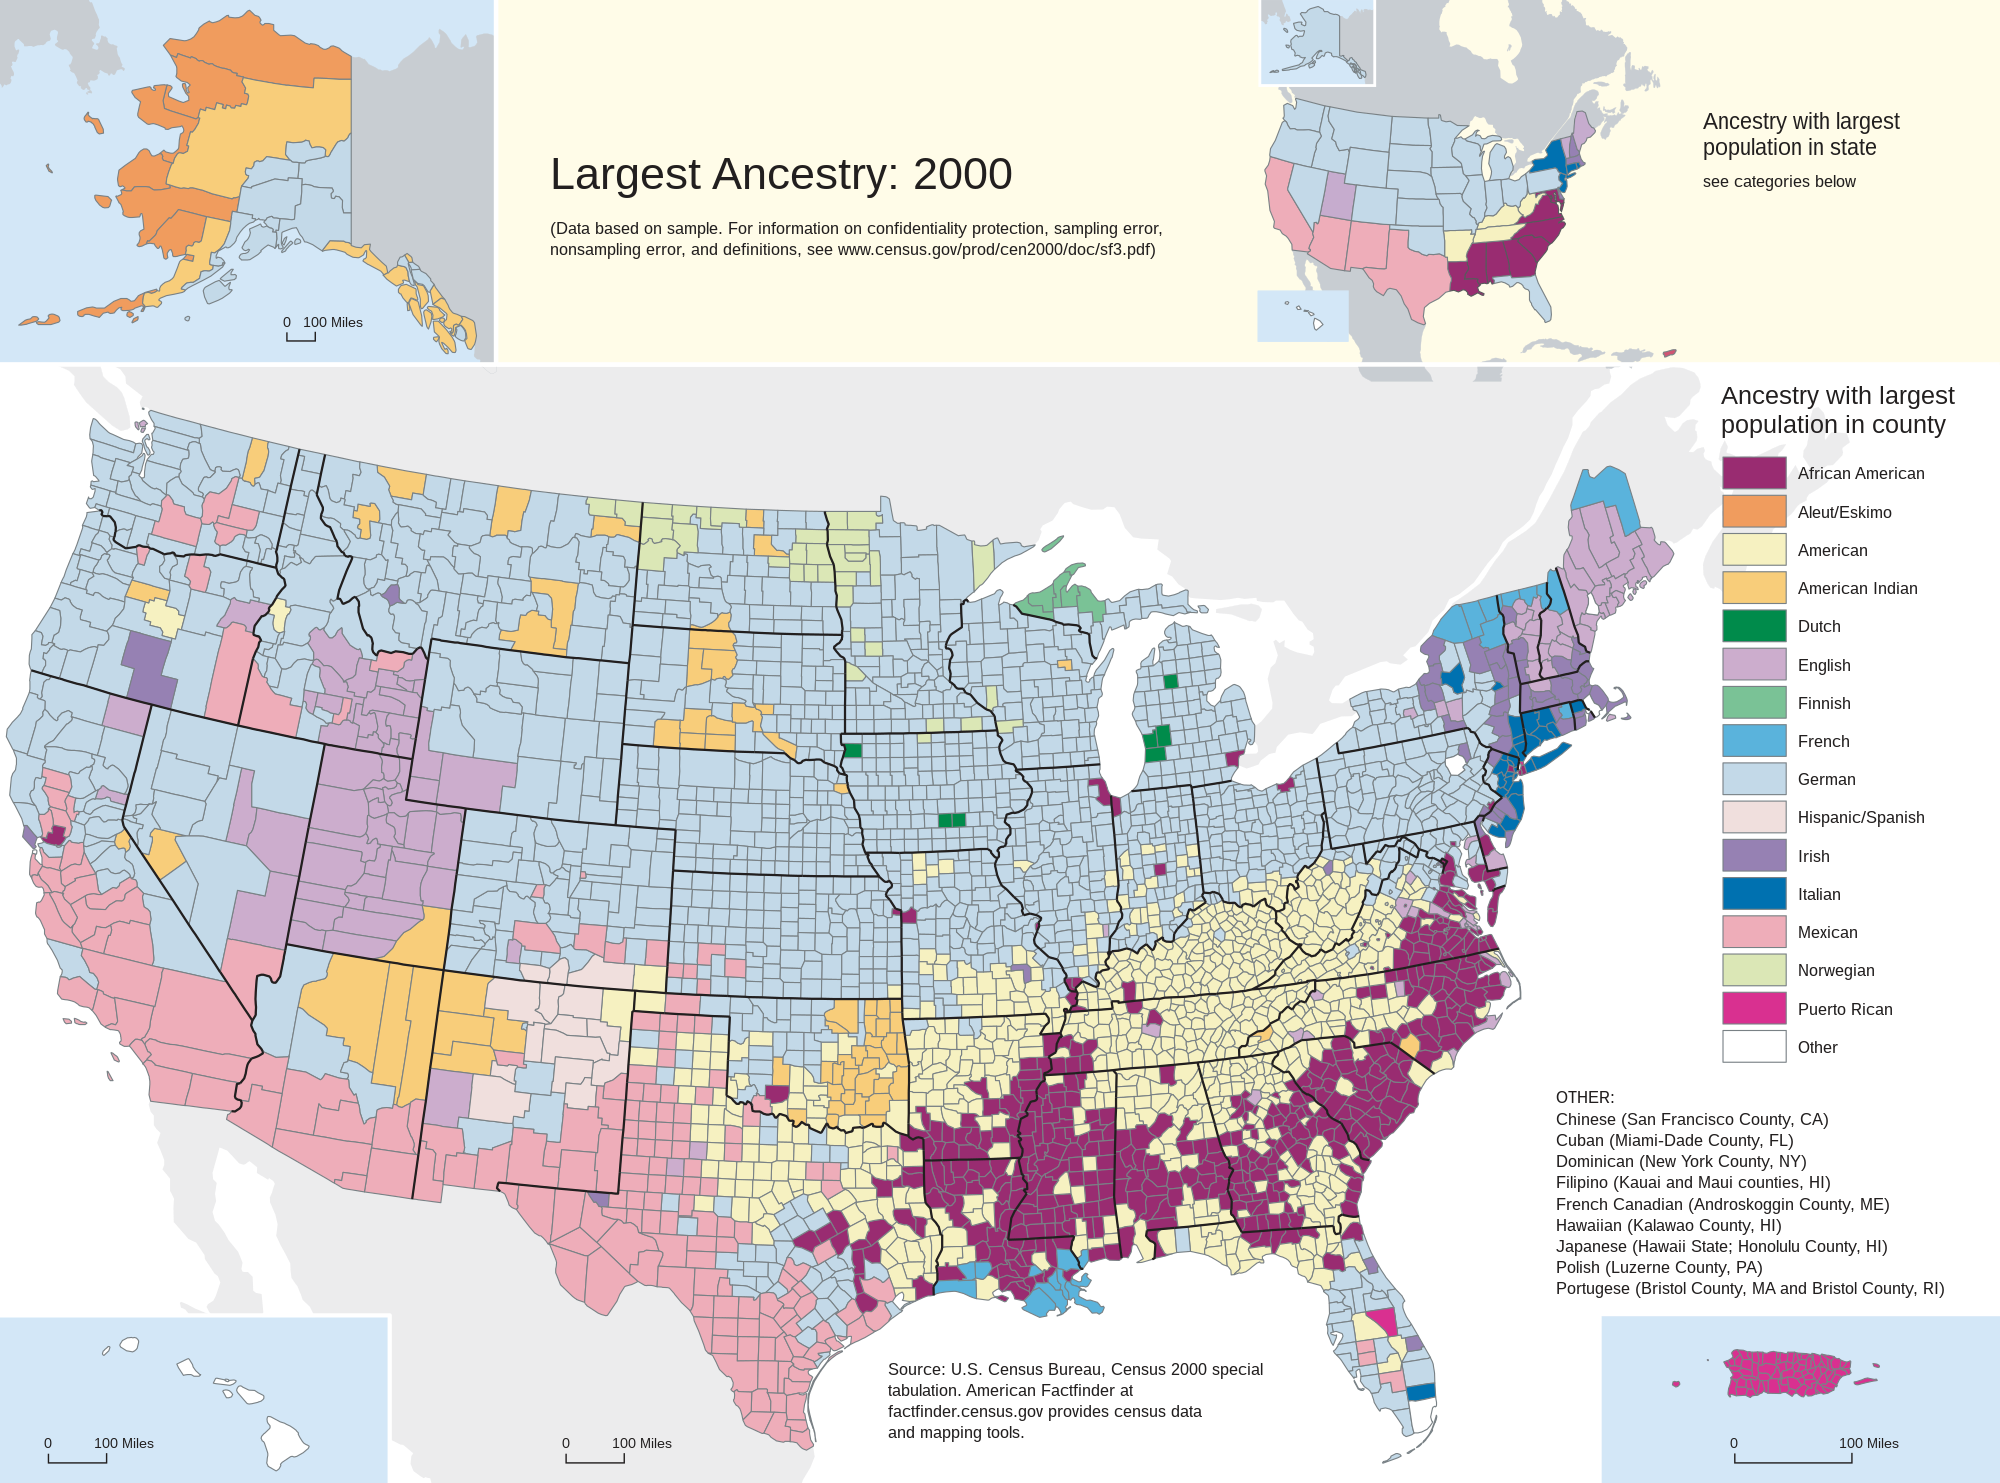
Do this: zoom out til you see the whole country. Now compare with this map:
http://upload.wikimedia.org/wikiped....svg.png
Thank you Capt. Obvious.
Genius Harvard Professor's Research
-
thibodeaux
- Posts: 8121
- Joined: Thu May 20, 2004 7:32 pm
He basically took a map of where blacks, Indians, and Mexicans live, and said "Don't live here." Pretty raciss if you ask me.
Plus, the results are just nonsense. Take the pathetic rural Louisiana parish I grew up in. Literally the only jobs here are WalMart, sawmills, and offshore oil rigs. Its rating:
"Sabine Parish is pretty good for children in average-income families. It is better than about 75 percent of counties."
Now take Wake County, NC. Several of you people have lived here. Home to one university with two more just down the road. Lots of high-tech jobs. Its rating:
"Wake County is extremely bad for children in average-income families. It is among the worst counties in the U.S."
The results are similar for all income quartiles. Ridiculous.
